Forlag – Publishing Sales & Inventory Analytics Dashboard
An end-to-end analytics dashboard for a Norwegian publishing company, turning raw CSV files into live sales, inventory, and customer insights.
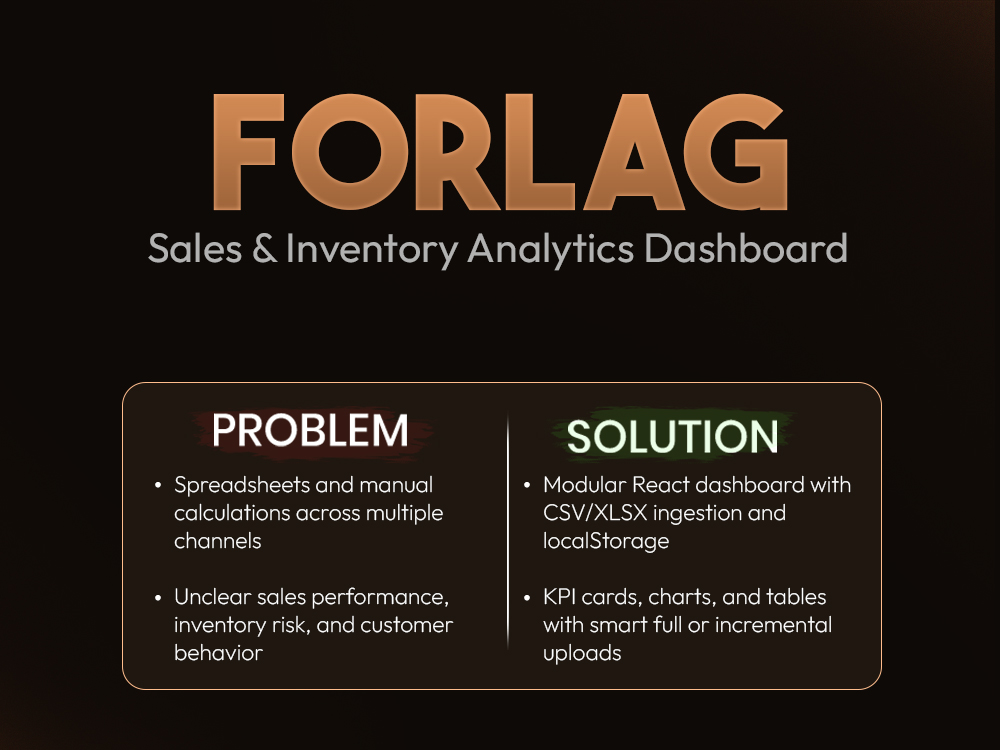
The Problem
The client managed sales and inventory through multiple spreadsheets and manual calculations, making it difficult to understand MTD/YTD performance, inventory risk, and customer behavior across different channels and time periods.
Our Solution
We designed and built a modular React dashboard that ingests raw CSV/XLSX files, normalizes dates, aggregates metrics per page, and stores processed data in localStorage. The dashboard exposes clear KPI cards, charts, and tables for sales, customers, orders, and inventory, all with a pixel-perfect UI. An advanced upload system differentiates between initial full imports and incremental updates, ensuring inventory data stays accurate without manual reconciliation.
The Results
- Replaced fragile Excel workflows with a visual, always-up-to-date dashboard.
- Implemented MTD/YTD comparisons with correct same-period logic across years.
- Designed a 7-KPI inventory overview including stock value, dead stock, and category breakdown.
- Built a CSV upload flow that supports both initial full imports and incremental updates by ISBN/SKU.
- Achieved fast performance even with 7,000+ order rows using pre-computed localStorage structures.
Key PerformanceIndicators
Measurable results that demonstrate project success
TechnologyStack
Modern technologies used to build this project
Technologies
ClientNotes
Short proof from people who trusted us with the work.
"The new dashboard finally gives us a clear, real-time picture of our sales and inventory. It feels tailored for our business, not like a generic off-the-shelf tool."